We thank all the Teachers, Researchers, Students, Participants, Customers and our Critics who made CARES SRG a reality.

Welcome to CARES SRG

We empathise with our clients cognitively and emotionally.

Next generation product

All in one place

CARESCenter for Applied Research and Educational Services
HomeCARES SRGLearning HubTrainingAboutContact
Book a call
Next generation product

Survey research, all in one place

CARES SRG, the Survey Research Guide, takes your questionnaire data to a finished research report. Preparation, reliability, analysis and reporting, all in one place.

See how it works →Explore the Learning Hub
CARES in numbers
200+
Programmes conducted
30,000+
Participants trained
600+
Clients served
and counting
CARES SRG · all in one place

Seven guided steps from raw survey file to report

The same project workflow every time, so a first-time researcher always knows what to do next.

  1. 1

    Project Information

    Name the study and set out what it measures.

  2. 2

    Import & Validate Data

    Excel, CSV, SPSS or Jamovi. The original stays untouched.

  3. 3

    Prepare Data

    Eight groups of tools, with every change recorded.

  4. 4

    Alpha Assessment and Score

    Check each construct with Cronbach's alpha, then score it.

  5. 5

    Variables & Reporting Labels

    Set the labels your report will use.

  6. 6

    Choose Analyses

    Tables, graphs and interpretation for each test.

  7. 7

    Create Report

    Download the Word report for your chapter.

Request a free trial[Trial length and plan prices to be added]
The product

Built for the first-time researcher

Reads the files you already have

Excel, CSV, SPSS, Jamovi and Google Forms exports, with item codes pulled from long headers.

Understands Likert answers

“Strongly agree” style text is detected and converted to a 5 or 7 point scale.

Checks reliability, and explains it

Weak items are flagged for review. Nothing is deleted for you.

Runs the right analyses

Frequencies, descriptives, correlation, t-test, ANOVA and regression.

Keeps a record of every change

Each preparation step is logged so a guide can check the work.

Writes the Word report

One download, ready to adapt into a dissertation chapter.

Create Report · one click to a Word report

Visuals

Charts that make a result clear at a glance, each placed where it belongs in the report.

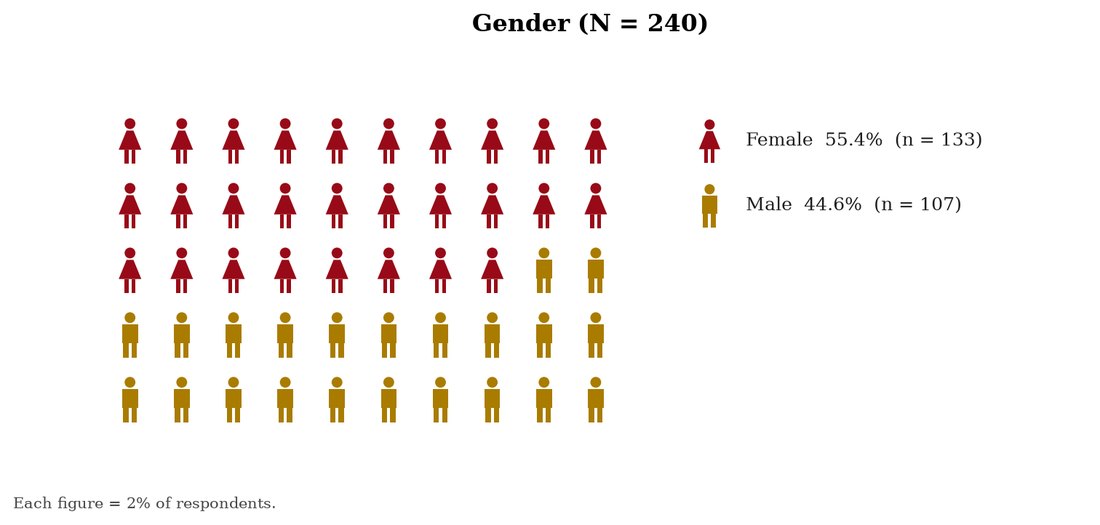
  • Pictograms for who answered
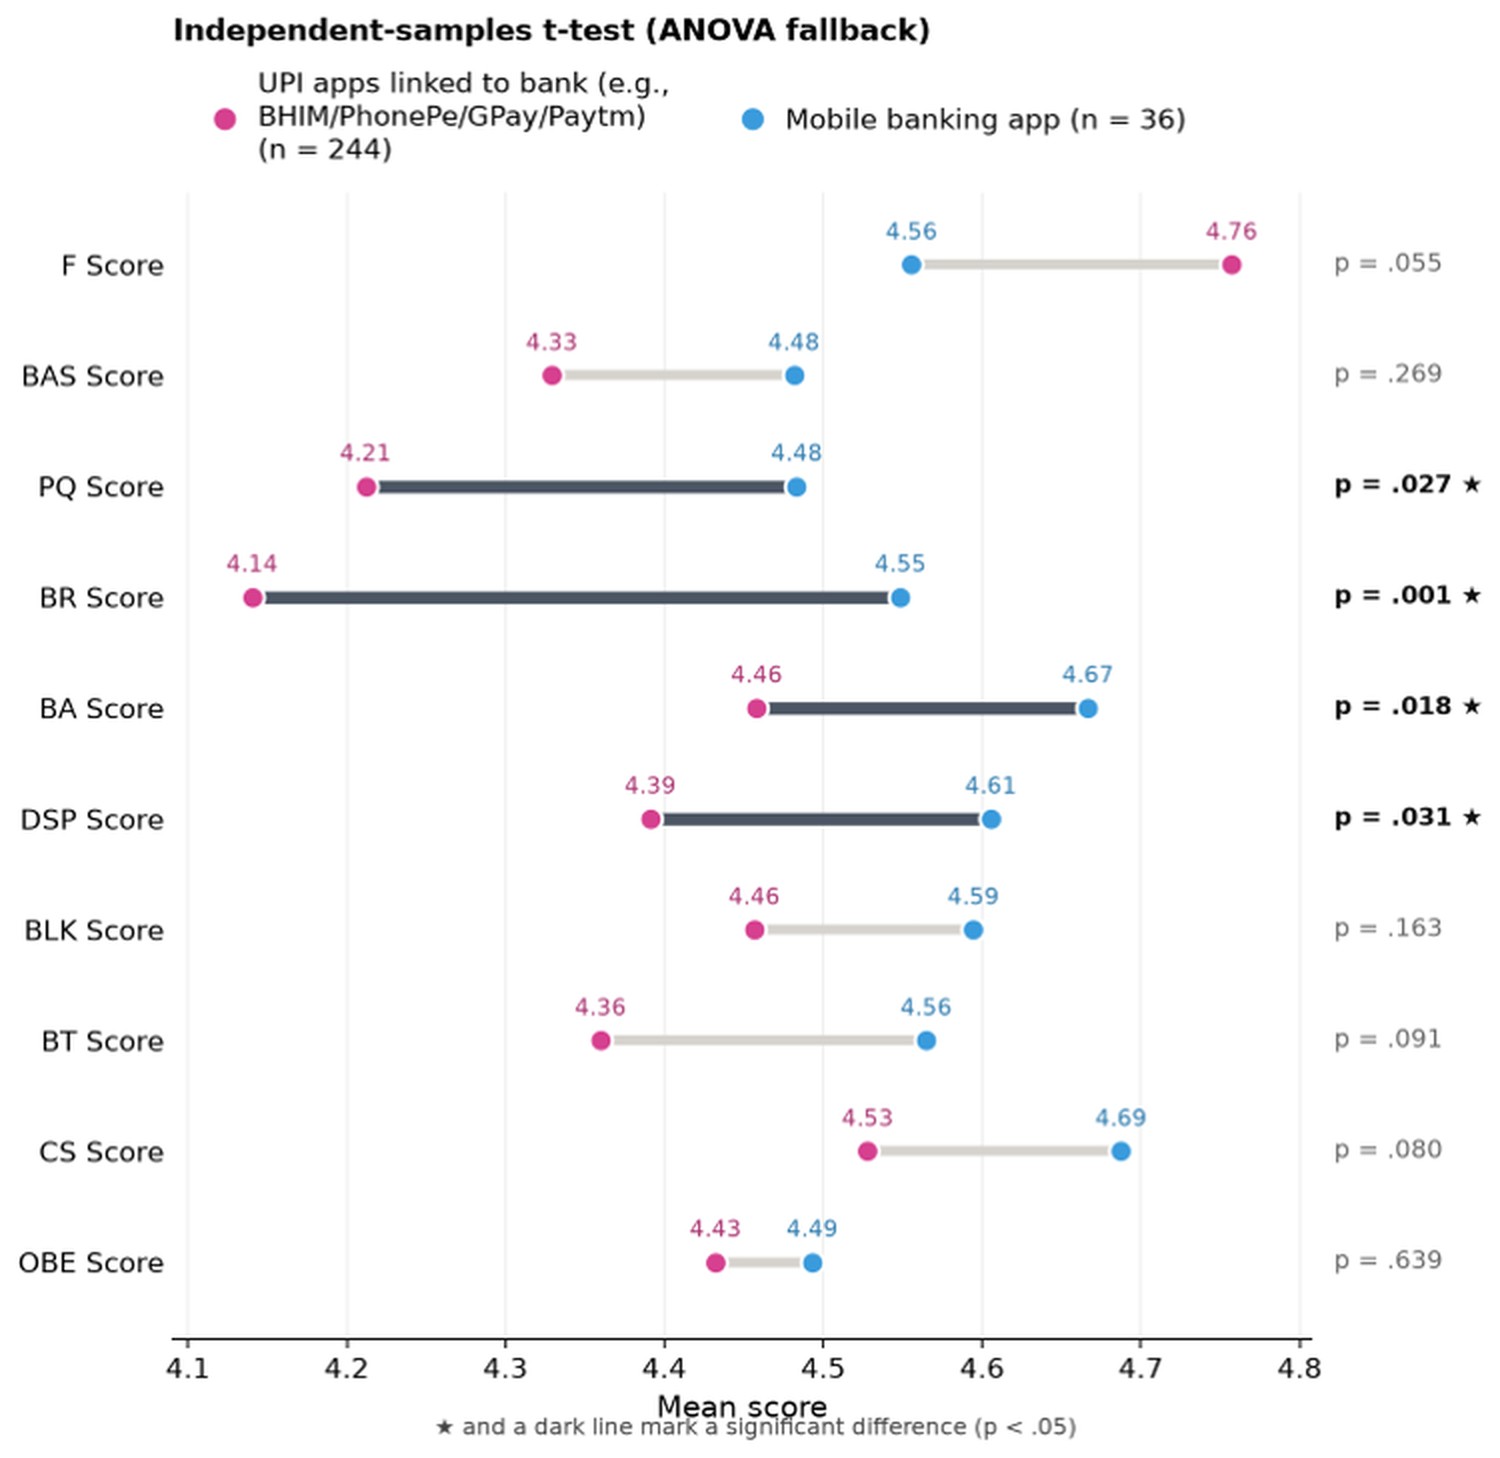
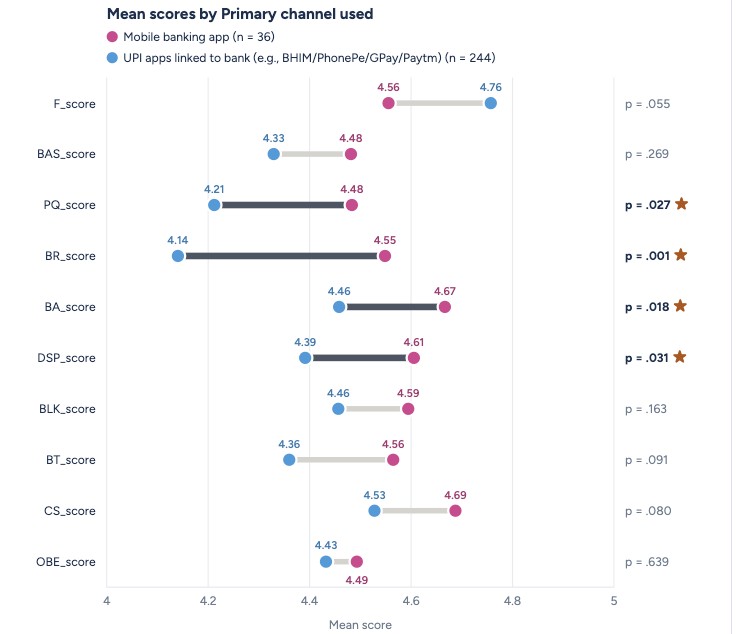
  • Group means side by side, with significant differences starred
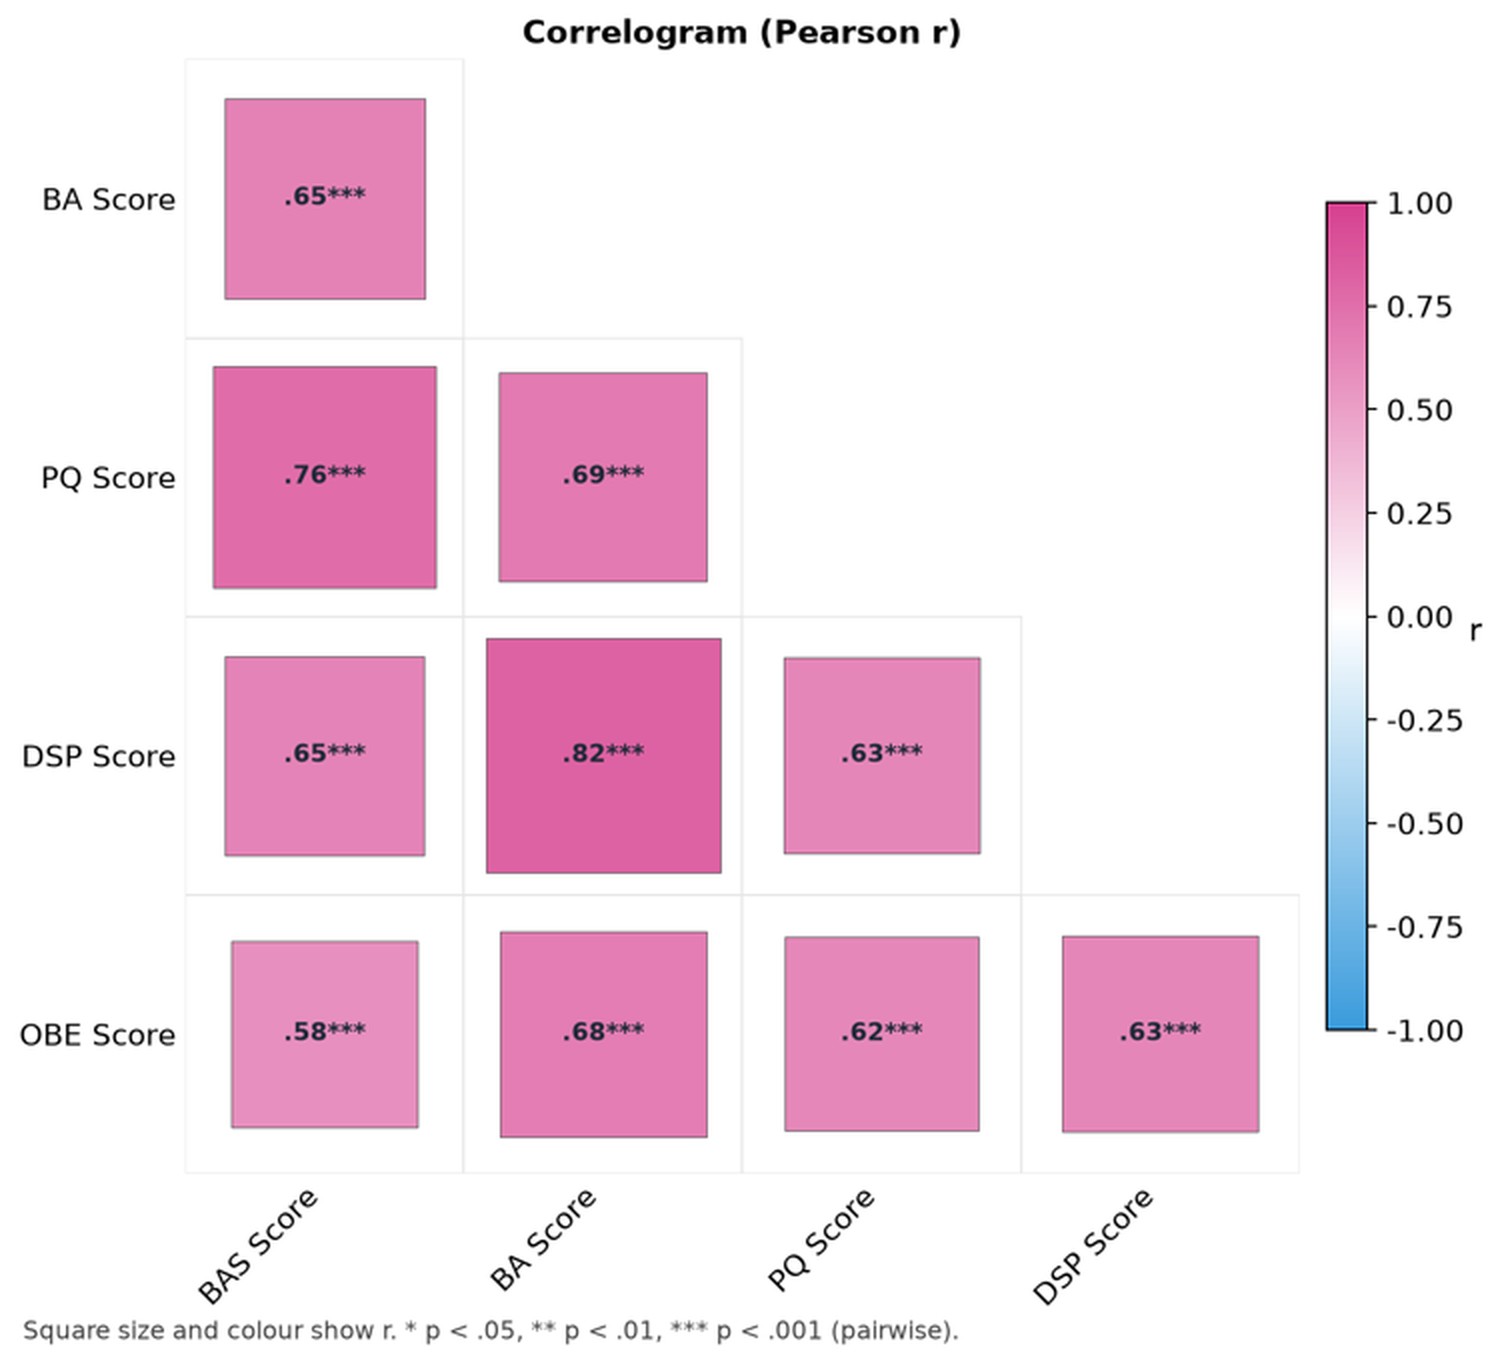
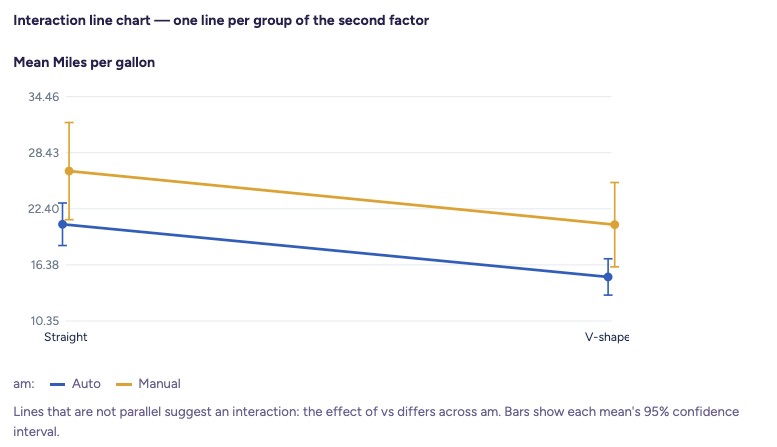
  • Interaction charts and correlograms
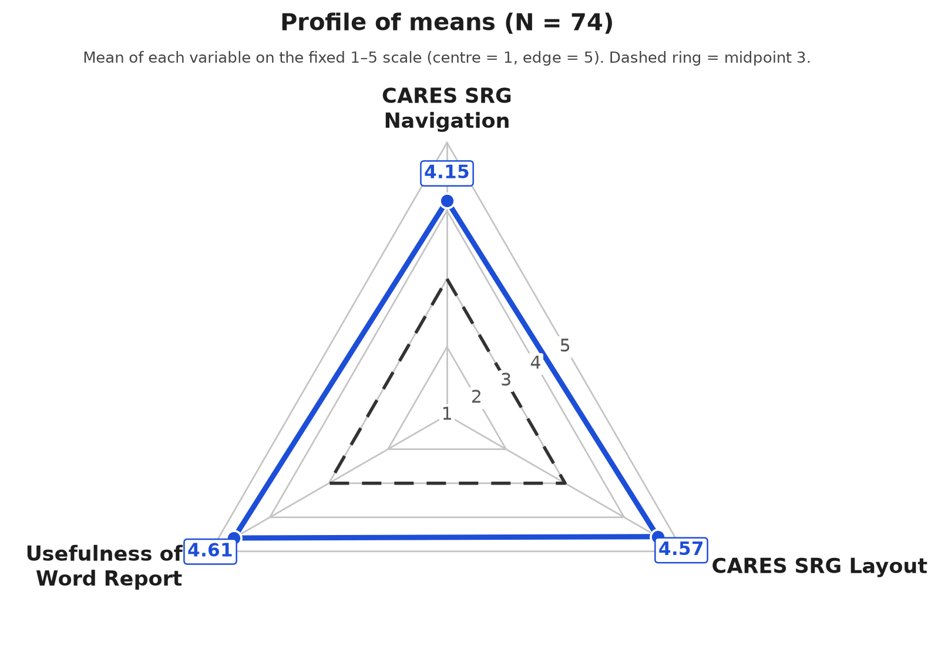
  • A profile of means on one chart

Reliability assessment

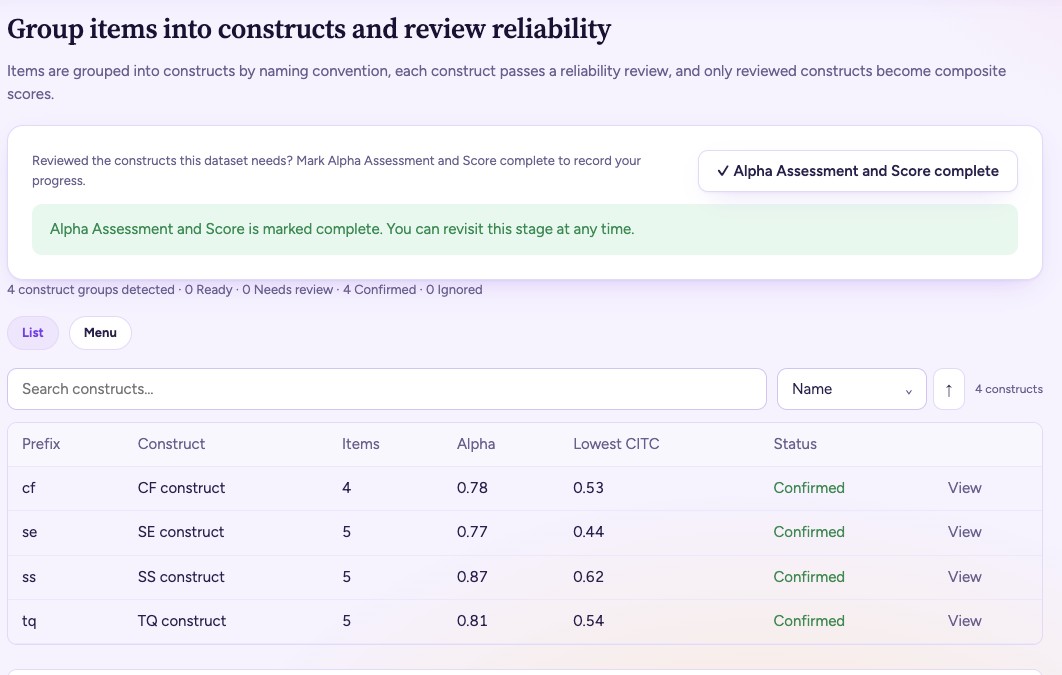
Check that the items of each construct measure the same thing before you score it.

  • Cronbach's alpha for every construct
  • Corrected item-total correlation for every item
  • Alpha if an item is deleted
  • Weak or reverse-worded items flagged for you to review

Regression

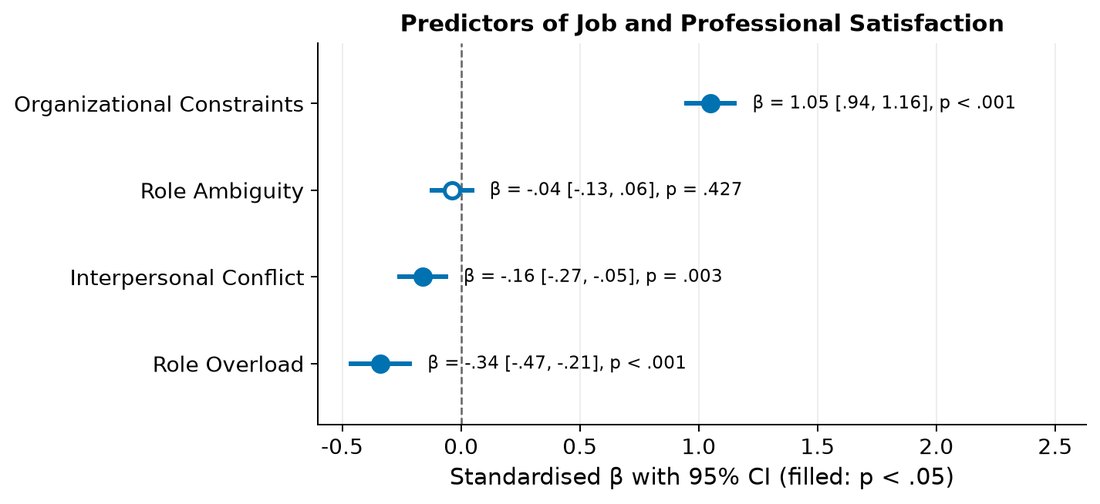
See which factors predict your outcome, and how strongly.

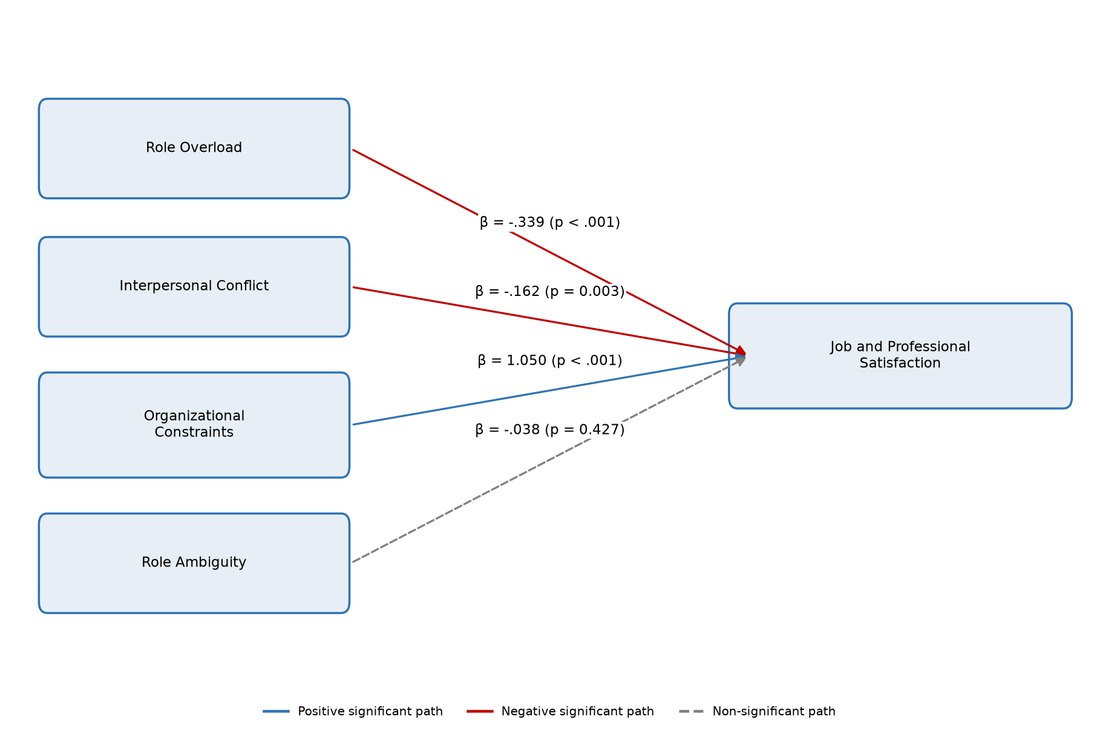
  • Model diagram with standardised estimates
  • Coefficients, model summary and bootstrap confidence intervals
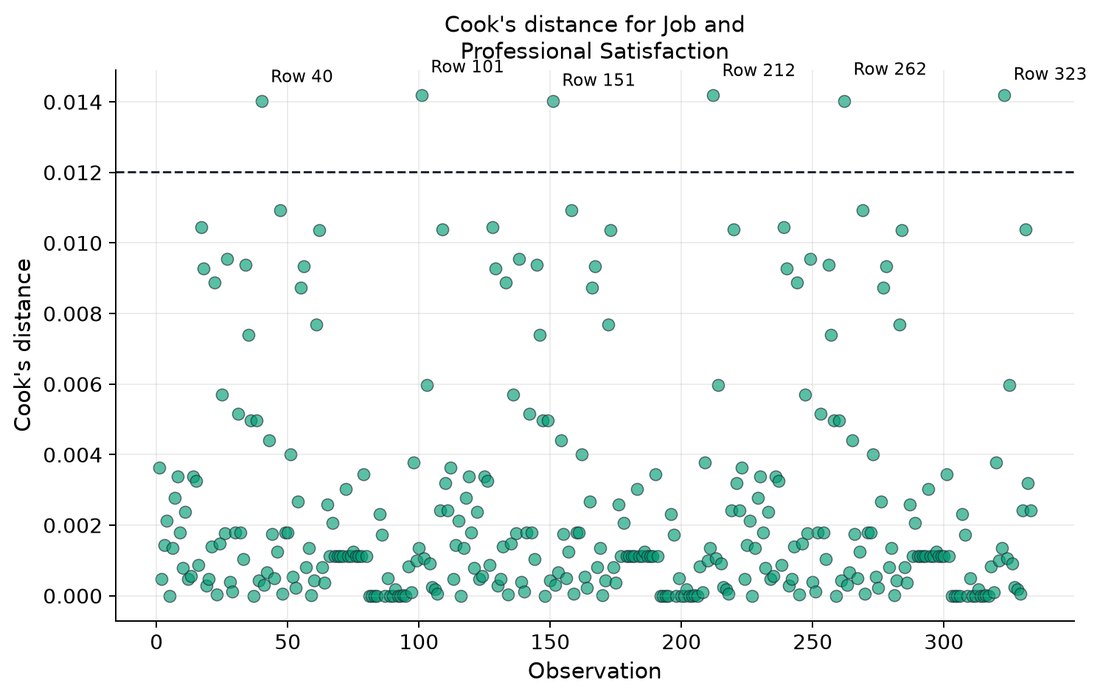
  • Diagnostics: residuals, Q-Q plot and Cook's distance
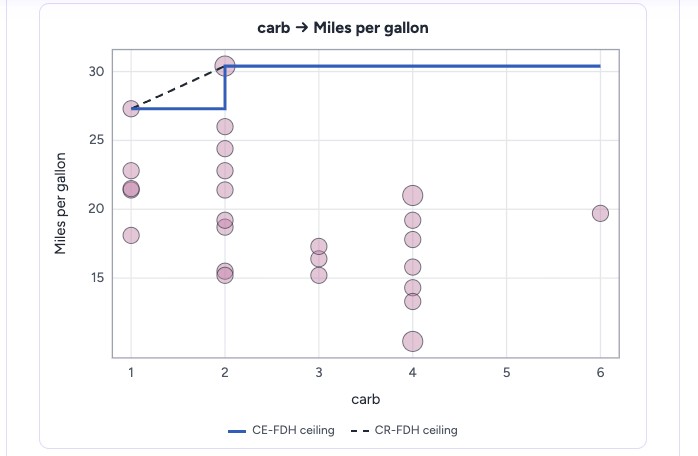
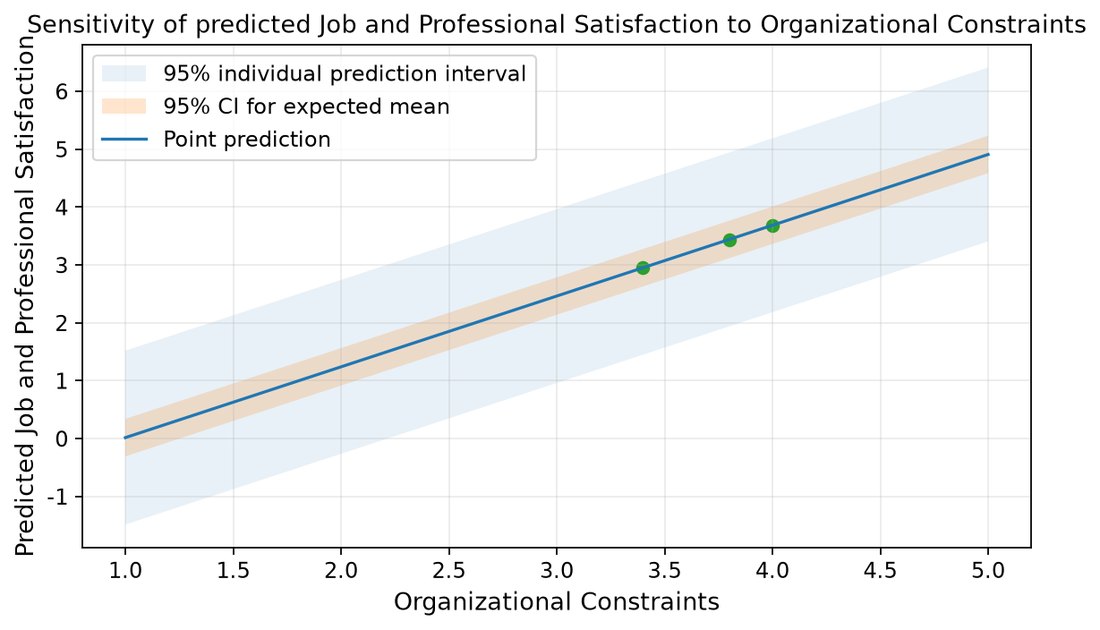
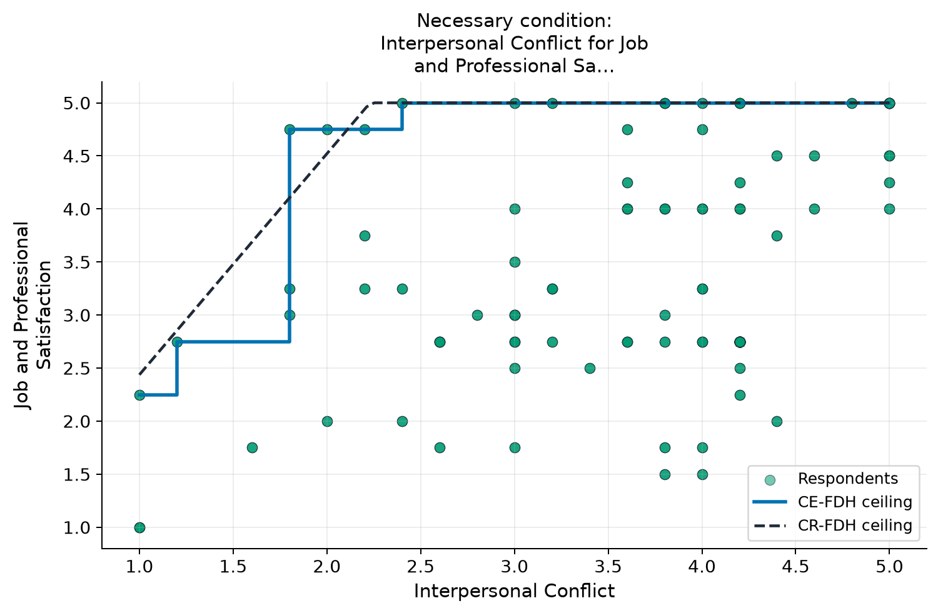
  • What-if scenarios and necessary condition analysis

CFA and structural models

Test the model your theory proposes, from measurement to structural paths.

  • Path diagram with standardised coefficients
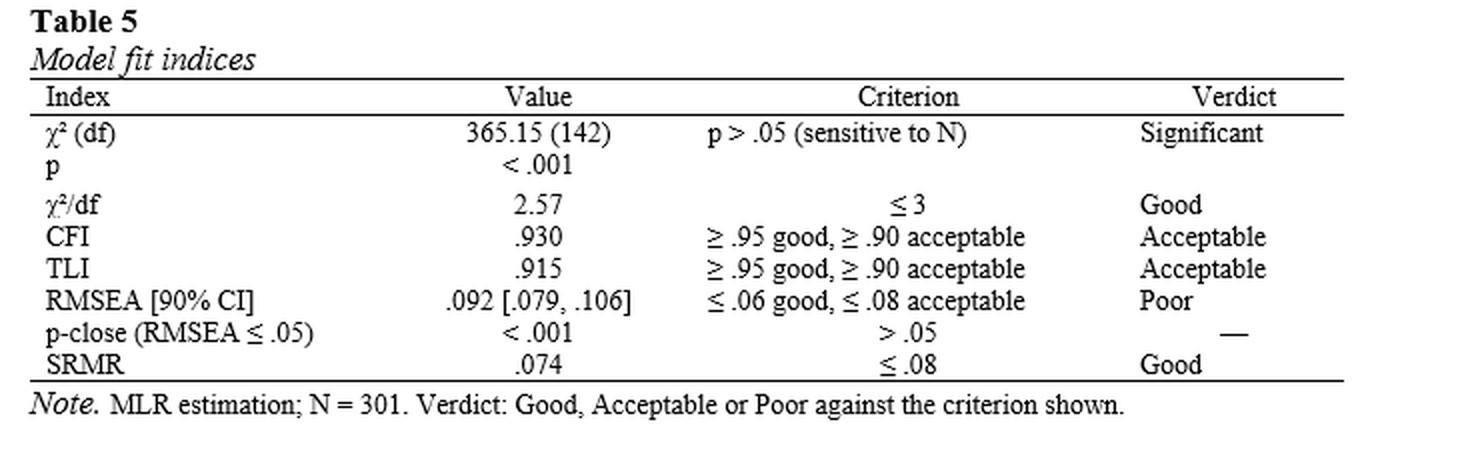
  • Model fit indices, with a verdict for each
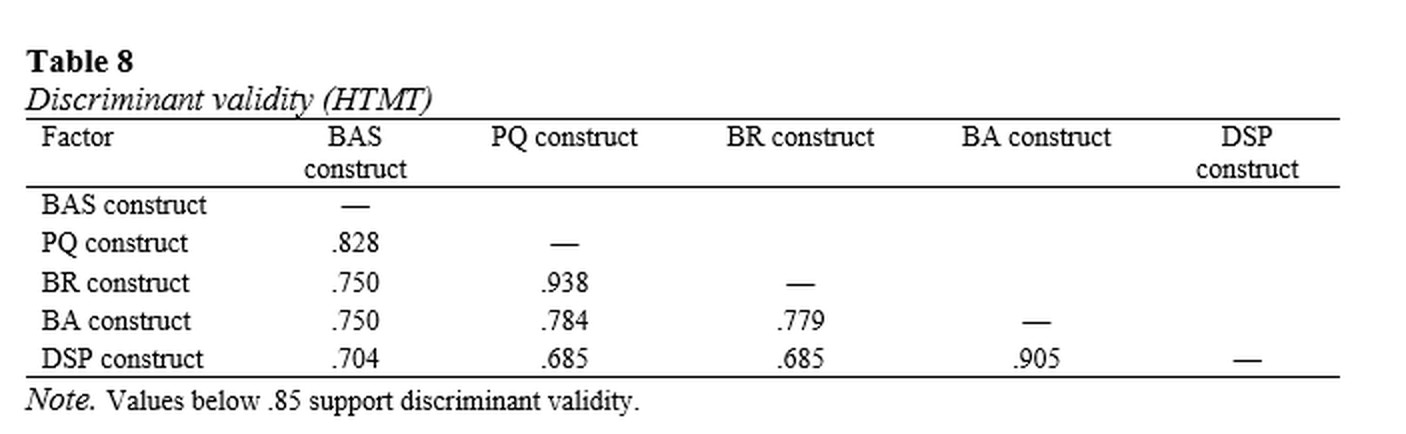
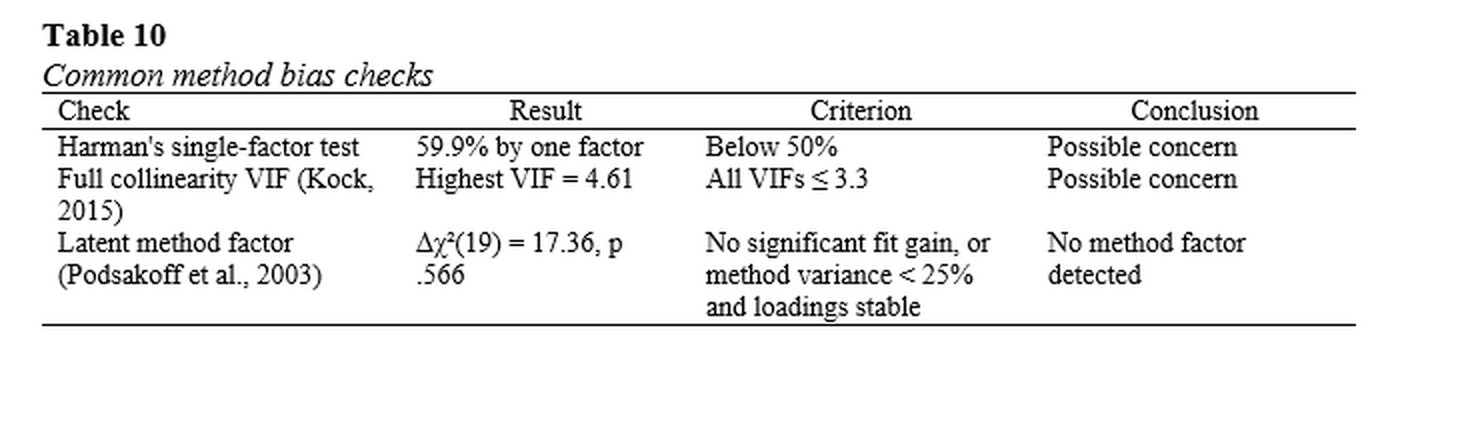
  • Discriminant validity and common method bias checks
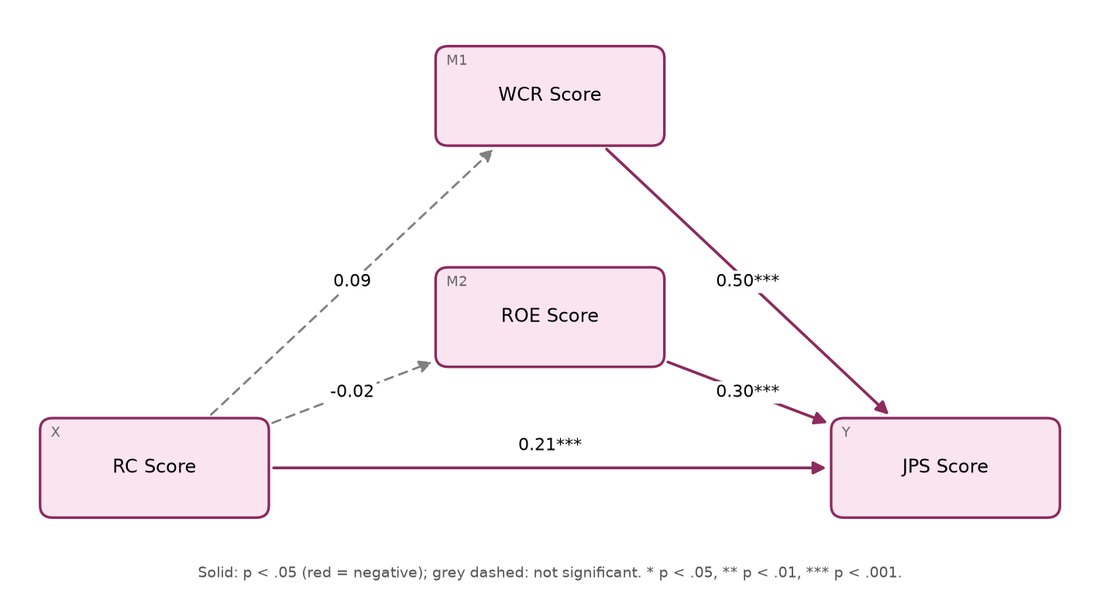
  • Mediation analysis

Exploratory factor analysis (EFA)

Let the data show how your items group into factors.

  • KMO and Bartlett's test
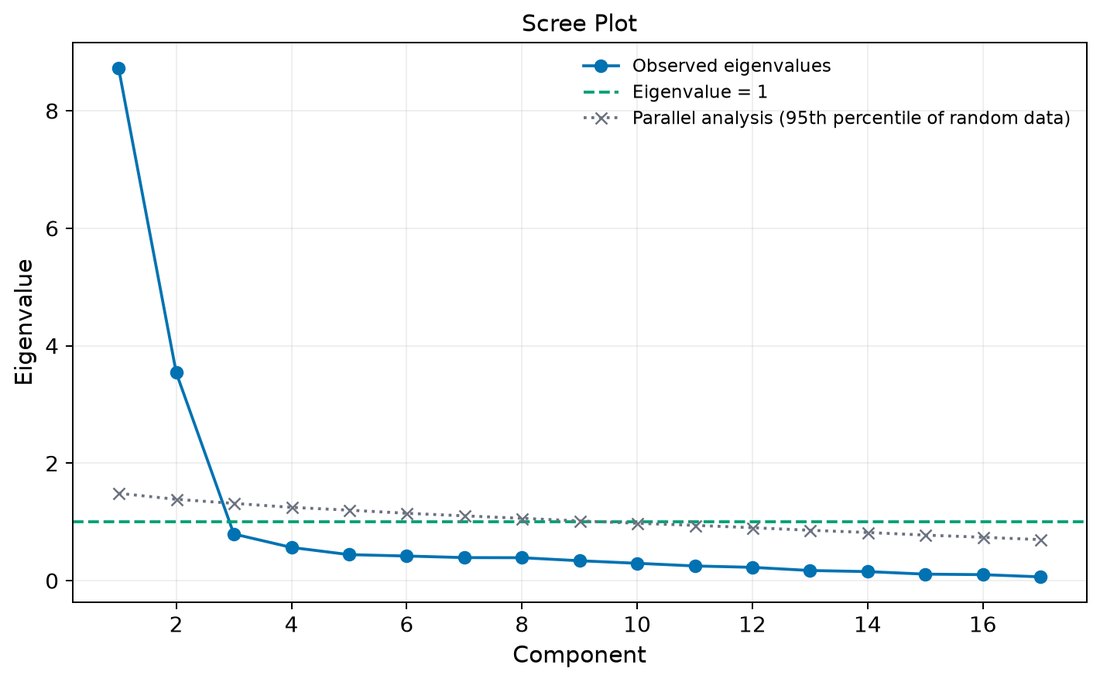
  • Variance explained and a scree plot with parallel analysis
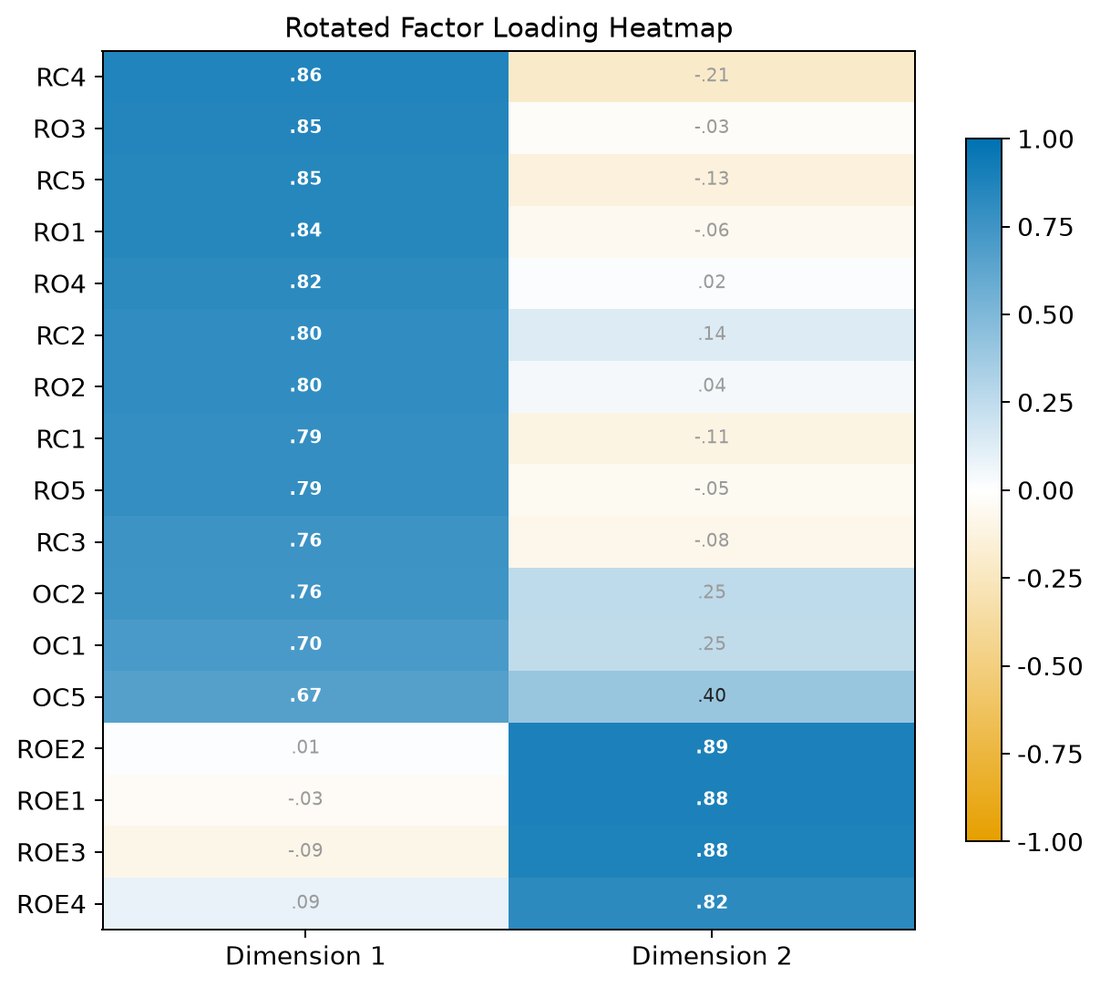
  • Pattern matrix and loading heatmap
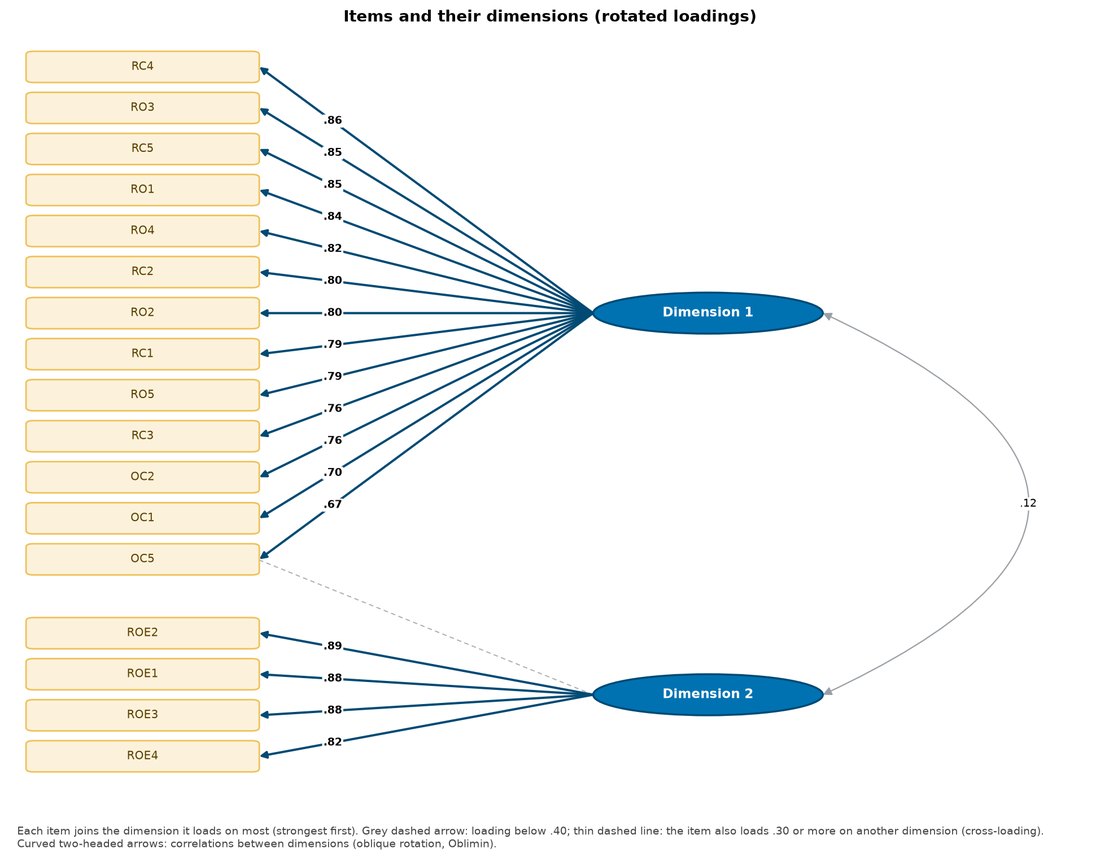
  • Items grouped into dimensions, with the reliability of each

fsQCA

Fuzzy-set qualitative comparative analysis: find the combinations of conditions that lead to an outcome.

  • Necessary conditions
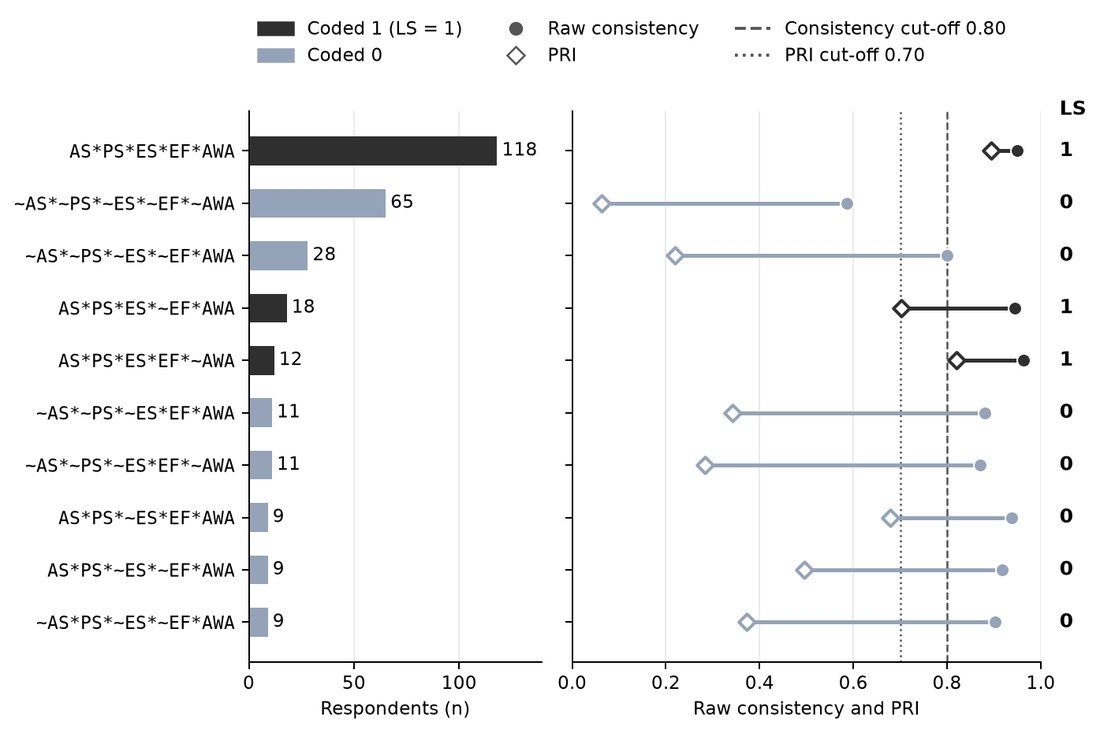
  • Truth table with raw consistency and PRI
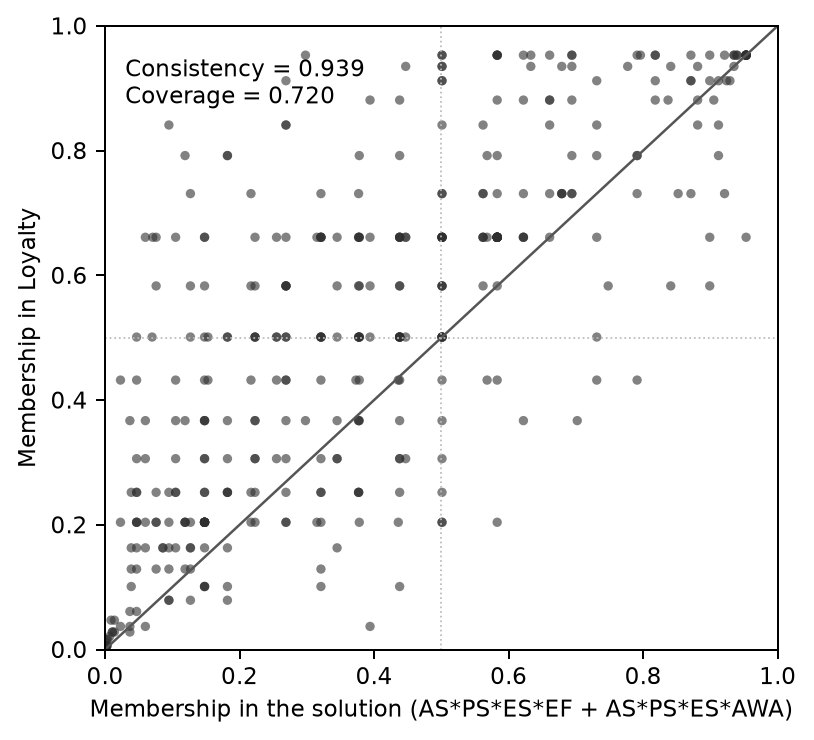
  • Consistency and coverage of the solution
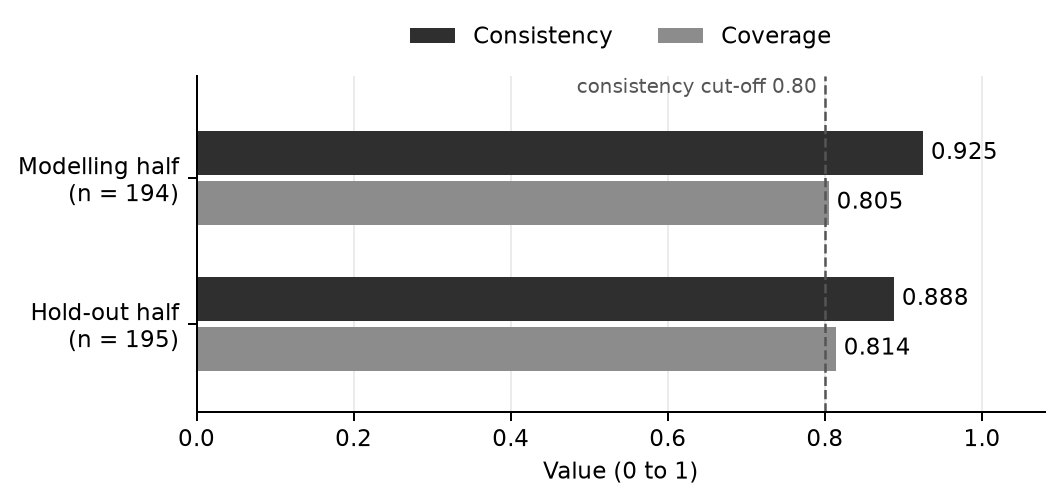
  • A hold-out check of the solution

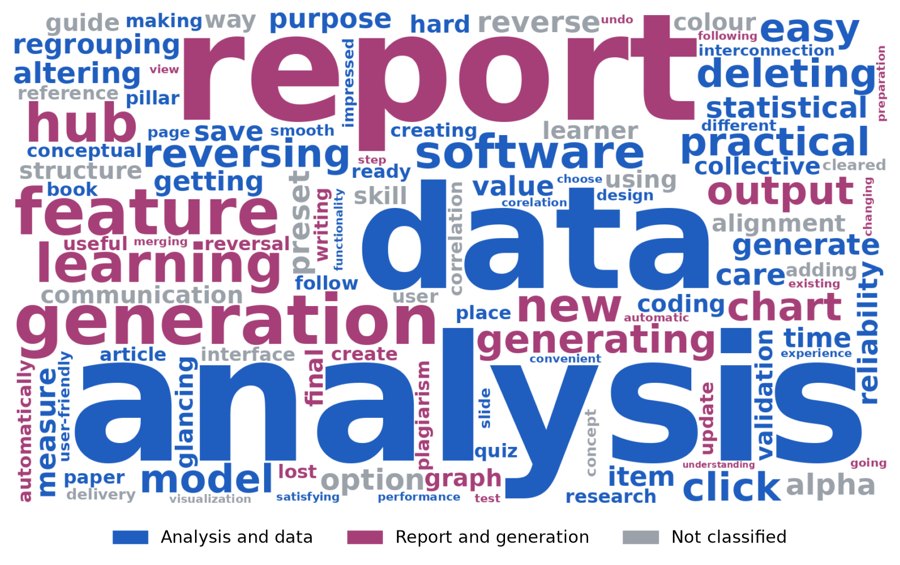
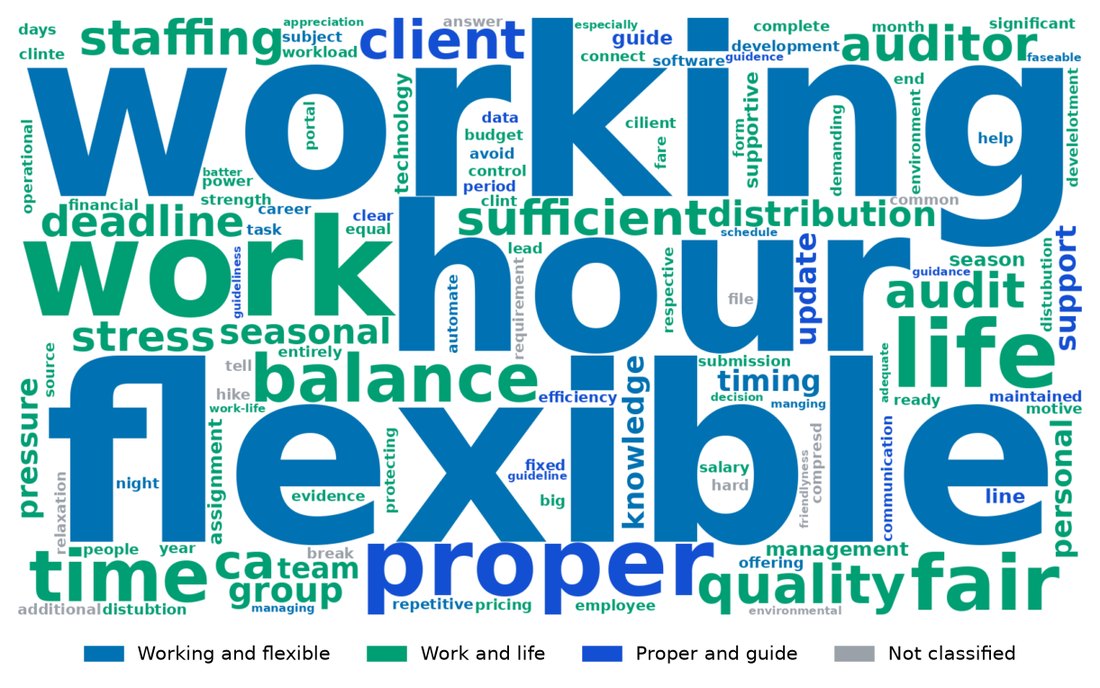
Word cloud

Open-ended answers, read at a glance. The larger the word, the more often it was used. Colour shows its theme.

  • Most frequent terms, in a table
  • Themes found in the answers
  • Example answers quoted for each theme

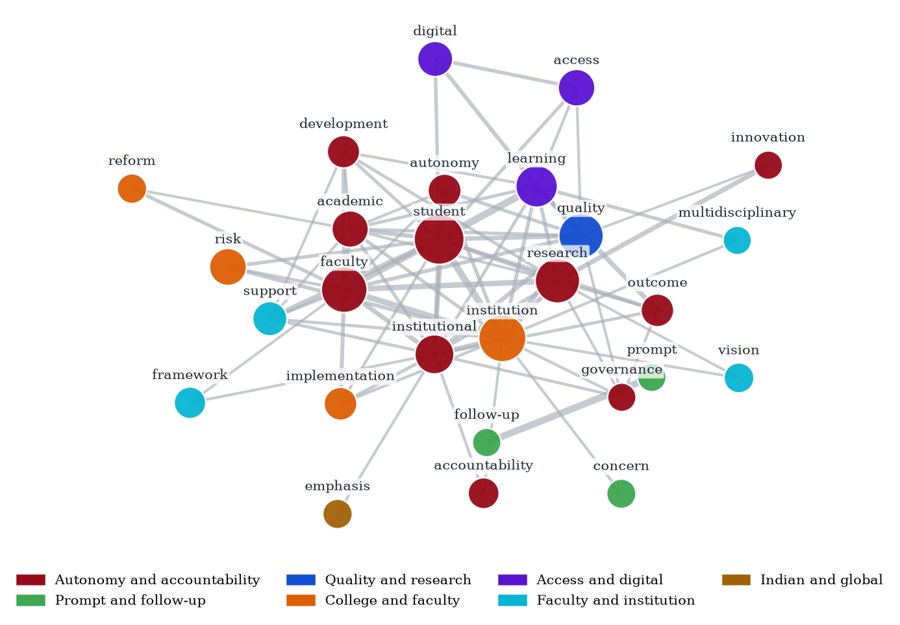
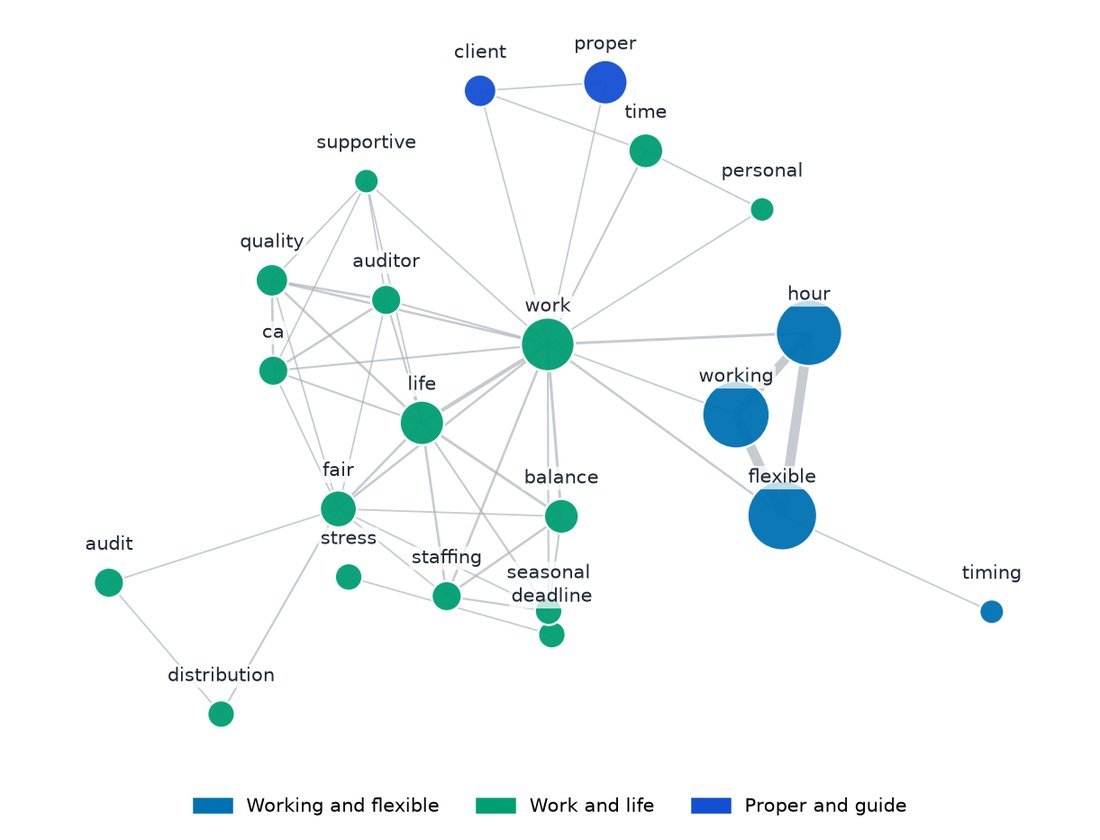
Word network

Words that appear together in the same answer are joined, so you can see how ideas connect.

  • Words linked when used together
  • Coloured by theme
  • Topics identified in the text

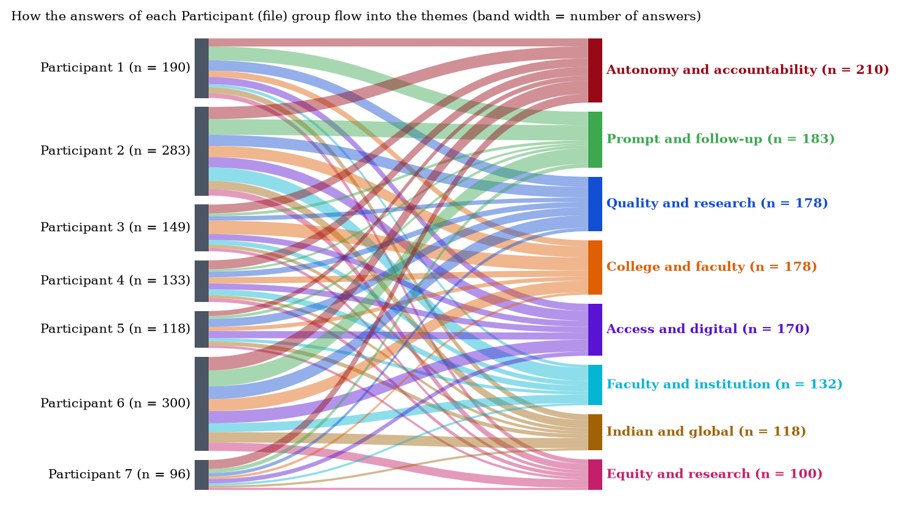
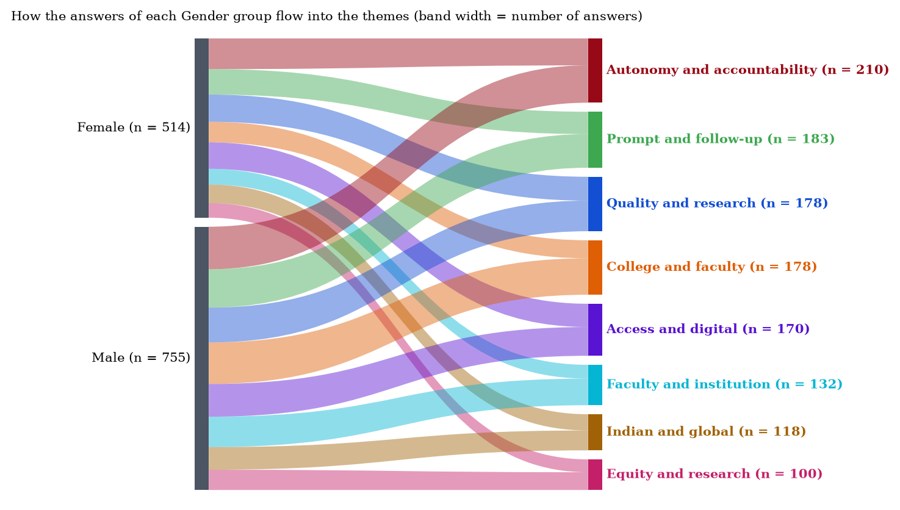
Sankey diagram

See how the answers of each group flow into the themes. The wider the band, the more answers.

  • Flows by participant, or by any group such as gender
  • Band width shows the number of answers
  • The number of answers is shown beside each theme

Every sample is taken from a real CARES SRG report. Click a graph to enlarge it.
Request a free trial
Models:
Textual analytics:
Pictogram of a frequency table: each figure stands for 2% of respondentsIndependent-samples t-test: group means side by side, with significant differences starredCorrelogram: Pearson correlations, with square size and colour showing strengthInteraction line chart: one line per group, with 95% confidence intervalsNecessary condition analysis: ceiling lines over the dataMean scores by group, with significant differences starredProfile of means on a 1 to 5 scale
Pictogram of a frequency table: each figure stands for 2% of respondents
1 / 7
Reliability review: every construct with its items, alpha, lowest CITC and status
Proposed model with standardised estimates and significanceStandardised coefficients with 95% confidence intervalsCook's distance, with influential cases flagged by rowWhat-if: predicted outcome as one predictor changes, with prediction intervalNecessary condition analysis: the ceiling line shows the level of a predictor needed for each level of the outcome
Proposed model with standardised estimates and significance
1 / 5
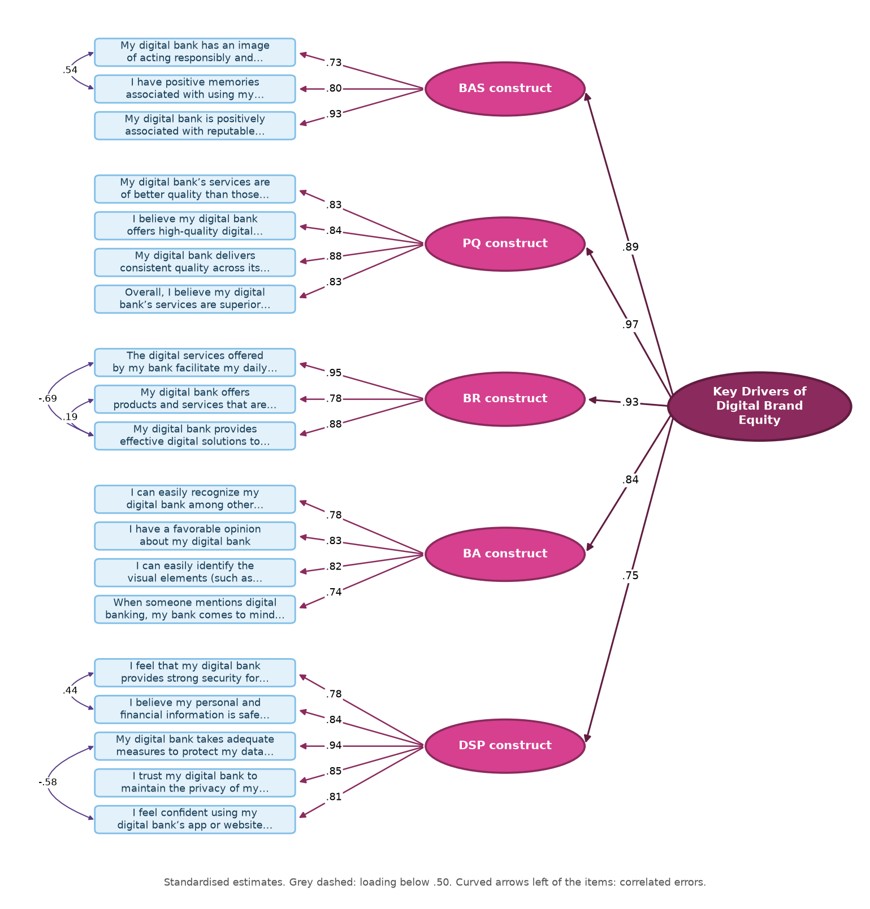
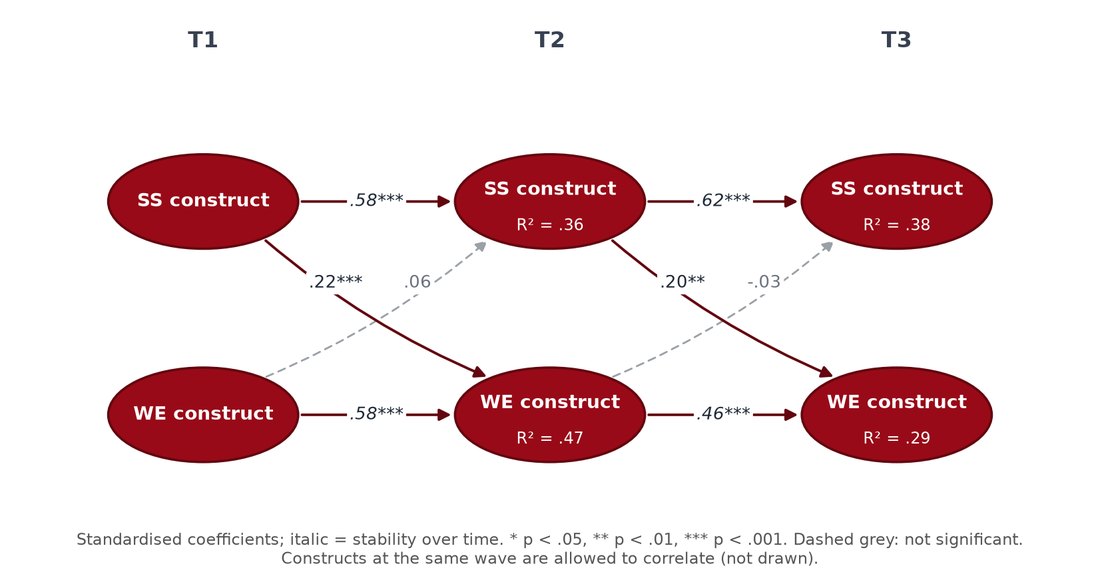
CFA model: item loadings on each construct and a second-order factor, standardised estimatesModel fit indices, each with its criterion and a verdictDiscriminant validity (HTMT) tableCommon method bias checks, with the criterion and conclusion for eachLongitudinal structural model across three waves, with standardised coefficients and R²Mediation model with path coefficients
CFA model: item loadings on each construct and a second-order factor, standardised estimates
1 / 6
Scree plot with parallel analysisRotated factor loading heatmapItems and the dimensions they load on
Scree plot with parallel analysis
1 / 3
Truth table rows with raw consistency and PRIMembership in the solution against membership in the outcomeConsistency and coverage for the modelling half and the hold-out half
Truth table rows with raw consistency and PRI
1 / 3
Word cloud of open-ended answers, coloured by themeWord cloud from a second study, coloured by theme
Word cloud of open-ended answers, coloured by theme
1 / 2
Word network: words used together in the same answerWord network from a second study, coloured by theme
Word network: words used together in the same answer
1 / 2
Sankey diagram: answers from each participant flowing into the themesSankey diagram: answers from each gender group flowing into the themes
Sankey diagram: answers from each participant flowing into the themes
1 / 2
Learning Hub · inside CARES SRG

All in one place, from plan to approved report

Top statistics software grade numbers, a mentor's guidance, and no AI writing your thesis. Research concepts, statistical choices, data preparation and navigation, arranged in four circles.

1Theory 2Statistics 3Technology 4Communication Methodology
1

Theory

11 topics

2

Statistics (data and measures)

26 topics

3

Technology and tools

10 topics

4

Communication and reporting

7 topics

Sample topic · Questionnaire Structure

An abstract concept reaches your analysis through seven steps. Each step is a decision you should be able to justify.

ConceptDimensionItemRatingScoreCheckAnalysis
Learning Hub · beyond the topics

Read, listen, play and self-check

Books for Effective Research

70+ books

Mentor's Notes

Listen or read.

Learning by Playing

Crossword, match the pairs, pick the right test.

Viva-Voce FAQ

100+ questions with model answers.

Did you know?

56 short facts on statistics, research and philosophy.

Quick Reads New

Flashcard-style summaries of key ideas, for a fast revision before you analyse or face your viva.

Research Self-Check

See where you stand in each area, then pick up the topics you need.

Also from CARES:4 video tutorials on YouTubeGraphs and models examples3 blogsStudy-break sounds while you work
Training

Research training

2-day student workshop

Book now

Faculty development programme

Book now

Research workshop

Book now

3-day training on PLS-SEM using SmartPLS software

Book now
National Institute of Design, Bangalore VTU Symbiosis SCMHRD D.Y. Patil University Krupanidhi Group of Institutions Nirma University VIT, Vellore PDPU, Gandhinagar Christ College Pune SSMRV University of Jammu Dayananda Sagar University St Joseph's College of Commerce AIMS Institutes
What participants say
“Made researcher life easy using CARES SRG.”
Dr. Uma SharmaRVIM, Bengaluru
“All in one place, bridge between legacy software and AI.”
Dr. BadriConsultancy
“Taking workshop with CARES has really jumpstarted my learning productivity.”
Santhosh KumariDept. of Commerce, University of Jammu
“Everything in one place: books, quiz, analysis, model making and the pillars it follows.”
Angeline PeterChrist College Pune
“Focused, professional, calmly delivered with a perfect balance of theory and practice.”
Sahil SinghDept. of Commerce, University of Jammu
“One of the fastest software for primary data.”
Chaithra SVTU research scholar
“User-friendly design, smooth performance, and practical functionality, which made the overall experience convenient and satisfying.”
Kirti NikamChrist College Pune
“Attending workshop on R studio delivered by CARES proved to be an outstanding experience.”
Vishav KritiDept. of Commerce, Jammu
“All collective features, also coding, reversing, deleting, also glancing the data. Which was very hard in other software.”
BakkaprabhuVTU research scholar
“Really appreciate your hard work behind this. Product is really good.”
Sandeep KaurChrist College Pune
“All the features are great. Automatically generating all the output is very useful.”
Chetan Krishnat GalageVTU research scholar
“Good work, reliable and trustworthy.”
UmaProfessor, Commerce
“Automatic preparation of report, do and undo, and going back and changing one test and taking a new report.”
Neha BanuSSMRV
“Getting reliability measures by reversing or deleting low value items saves time.”
Sneha GujarVTU research scholar
“Great help for data analysis!”
Priya GhalothChrist College Pune
“Very useful for the researchers.”
Snehal SugandhiVTU research scholar
“Excellent delivery and cleared concepts.”
Vandana BaisChrist College Pune
“Wonderful product!”
Ms. Fiza ShaikhChrist College Pune
About CARES

A research community, built one skill at a time

CARES works from a four-circle principle of research built over years of experience. Our organic approach lets corporates, researchers and students grow in increments, with a road map for moving through any problem.

Shankar MM

Shankar MM

Mentor

Mission

CARES exists to serve researchers in academia and industry with the tools and guidance they need.

Vision

CARES envisions a research ecosystem that empowers every researcher to push the limits of their field.

Gallery photo
Gallery photo
Gallery photo
Contact

Bring your survey data. Leave with a report.

Golden Square, 1101, 3rd Floor, 24th Main, JP Nagar 1st Phase, Bangalore 560078

+91 99018 57466

InstagramFacebookYouTubeLinkedIn

© 2026 Center for Applied Research and Educational Services

Send an enquiry

This preview does not send enquiries yet. Please call the number shown.